Carbonation Depth Testing: What the Phenolphthalein Line Actually Tells You
The purple line is not a measurement of damage. It is a pH indicator read against a rough surface, and misreading it is how good concrete gets replaced.
Technically reviewed by Dr. Ayşe Demir, structural engineering.
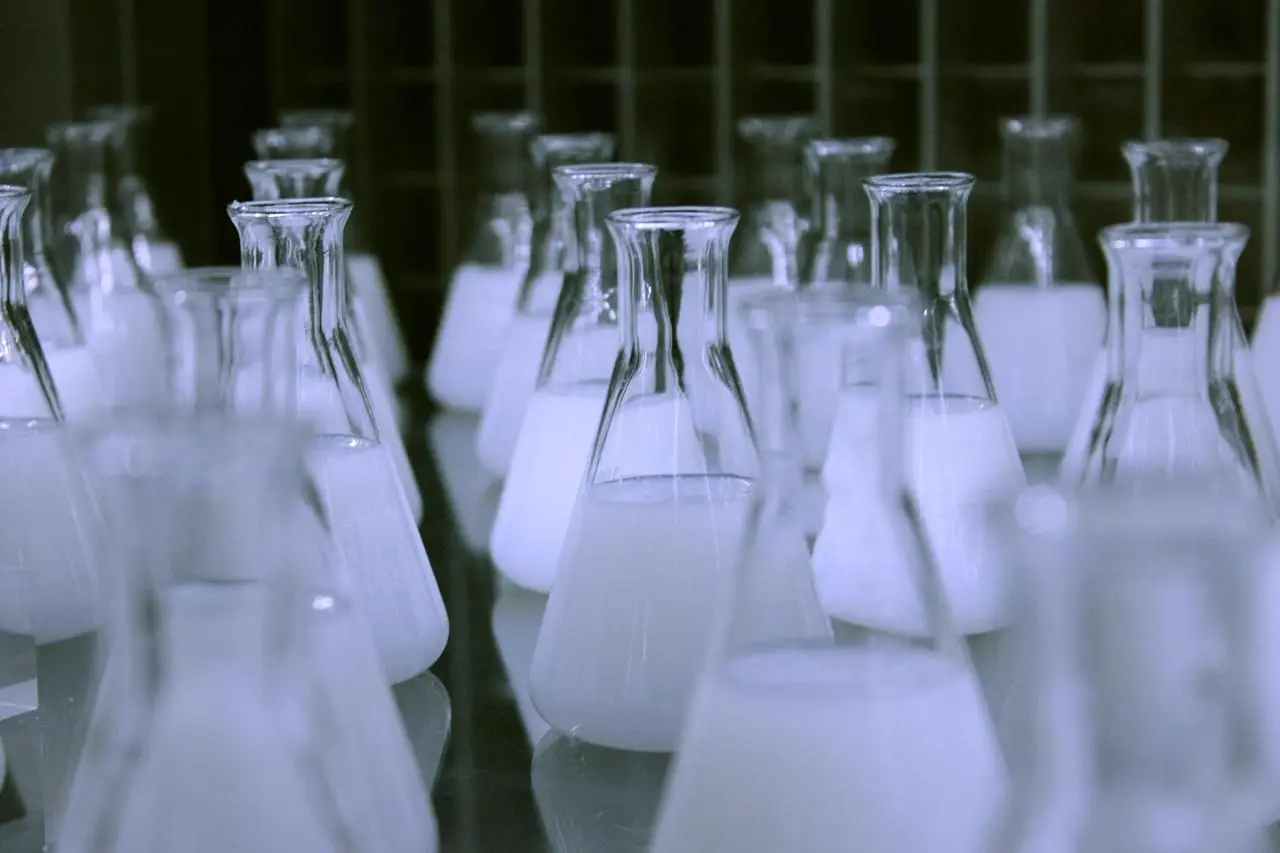
Spray a freshly broken concrete face with phenolphthalein and the result is immediate, theatrical and frequently misinterpreted. The clear zone near the surface is carbonated; the purple zone is not. Somewhere between them is a line that engineers then treat as a number, quote in a report, and use to justify a repair budget.
The test is genuinely useful. It is also one of the most easily abused measurements on a condition survey, because the line is a pH threshold rather than a material boundary, the surface is rough, and the reading depends on how you broke the concrete and when you sprayed it.
What carbonation actually is
Carbon dioxide from the air dissolves in pore water and reacts with calcium hydroxide and calcium silicate hydrate, forming calcium carbonate and water. The effect is a reduction in pore-water pH, from around 12.5–13.5 in fresh concrete to roughly 8.5–9 in fully carbonated material. Reinforcing steel passivates above a pH of about 9.5 to 10; below that, the passive film becomes unstable, and corrosion can initiate given moisture and oxygen.
That is the mechanism the test is really probing: not “how much carbonation”, but “how far the pH has dropped below the passivation threshold”.
The method, done properly
The standard approach — EN 14630 in European practice, with equivalents elsewhere — is straightforward in principle:
- Expose a fresh surface by breaking or core-cutting the concrete, not by sawing, which smears and polishes the pore structure.
- Clean the surface of dust and loose material.
- Spray a 1% phenolphthalein solution in ethanol (not water, which alters the reading).
- Read the depth after the colour develops, typically within minutes, measured perpendicular to the surface.
- Take multiple readings per location and record the mean, the range and the exposure condition.
Two details decide whether the number means anything. First, the surface must be perpendicular to the exposed face and measured with a rule, not estimated. Second, the reading must be taken where the concrete is representative — not in a spalled pocket, not in a repair, and not at a corner where two-dimensional carbonation has advanced faster.
Why the line is not a boundary
Phenolphthalein changes colour over a pH range, and the transition is not instantaneous at 9.0. In practice the indicator shows colour at a pH around 9.0–9.5, so the “carbonation front” is a contour of a chosen pH, not the limit of the reaction. Behind the visible line, carbonation is partial, and ahead of it, pH is already falling.
There is also a mechanical artefact. Breaking concrete creates microcracking, and the spray penetrates those cracks, producing a ragged or falsely deep front. On weak or porous concrete, the indicator can bleed into the material and exaggerate the depth by several millimetres. This is why the standard insists on a broken face and a careful reading, and why a single reading near a crack is worth nothing.
Reading depth against cover
Carbonation depth on its own is not a condition rating. The number that matters is depth relative to cover, because depassivation of the steel requires the front to reach the bar — and then moisture and oxygen to be present.
| Carbonation depth | Cover | Interpretation |
|---|---|---|
| 3 mm | 40 mm | Front far from steel; no corrosion risk from carbonation |
| 25 mm | 30 mm | Front approaching the bar; risk in wet exposure |
| 45 mm | 30 mm | Front beyond the bar; depassivation likely, inspect for corrosion |
| 10 mm at 2 years | 25 mm | Unusually rapid; check mix, curing and exposure |
A useful derived check is the carbonation coefficient from the square-root-of-time relationship: depth ≈ k√t. Back-calculating k from a measured depth and an assumed age gives an indication of rate — values in the range of 2 to 6 mm per √year are typical for ordinary Portland cement concrete in sheltered exposure, with higher rates in porous or poorly cured mixes. Treat the result as a trend indicator, not a prediction, because the rate falls as carbonation proceeds and the exposure is never constant.
When carbonation is the wrong diagnosis
Not every corrosion problem is carbonation, and the difference changes the repair. Chloride-induced corrosion produces a different pattern: pitting, often localised, frequently where chlorides came from de-icing salt, marine exposure or contaminated aggregate. Testing for chlorides by acid-soluble or water-soluble extraction should run alongside the carbonation survey whenever corrosion is found, because a carbonation repair applied over chloride-contaminated concrete will fail early and expensively.
The other misdiagnosis is cosmetic. A carbonated surface with dry cover and no cracking is not necessarily a repair trigger; it is a durability input to a service-life calculation. The trigger is the combination of depth approaching cover, moisture availability and evidence of corrosion activity — half-cell potential mapping, resistivity, or simply rust staining and cracking along the bar line.
Repair strategies and what each one actually does
| Strategy | What it changes | When it is credible |
|---|---|---|
| Do nothing, monitor | Nothing — establishes a trend | Front well short of cover, dry exposure |
| Replace contaminated cover with repair mortar | Restores alkalinity and cover locally | Localised, front near or past the bar, sound substrate |
| Silane / hydrophobic impregnation | Reduces water ingress, not CO₂ ingress | Prevention on sound, uncarbonated concrete |
| Re-alkalisation (electrochemical) | Raises pH around the steel | Carbonated but chloride-free, accessible soffits |
| Cathodic protection | Shifts the electrochemical potential | Chloride-contaminated or repeatedly repaired structures |
Two of these are routinely sold as carbonation repairs when they do not address carbonation at all. A surface coating slows water and can slow CO₂ diffusion, but it does not reverse a front that has already passed the steel. And a repair mortar patch fixes the patch; it does not treat the surrounding area where the front continues to advance.
A survey that supports a decision
A carbonation survey worth paying for contains: a plan of test locations with exposure notes, at least three readings per location, cover measurements at the same points (cover meter, calibrated against a local breakout), chloride results where corrosion exists, and photographs of each sprayed face with a scale. From those, an engineer can produce a depth-versus-cover map and a defensible repair extent.
What it should not contain is a single number presented as a building-wide finding. “Carbonation depth 18 mm” tells you nothing until you know where, at what cover, in what exposure, and with what scatter. The scatter is often the most useful output: a range of 8 to 32 mm across a façade is a story about curing and compaction, and it usually points at the columns and beams that were cast in a hurry.
The indicator is cheap, fast and honest — as long as the person reading it understands that the purple line is a chemical threshold on a broken surface, not a measurement of how much structure is left.
Keep reading
Related notes from the same sections of the desk.

Glass, Carbon or Aramid: A Selection Matrix for FRP Strengthening
Three fibres, three cost points, three failure profiles. A practical comparison of modulus, elongation, durability and cost for structural strengthening.
Epoxy or Polyurethane? Choosing an Injection Resin for Crack Repair
Both resins go into a crack through a port. Only one of them is structural, and the choice depends on whether the crack is moving, wet or wider than you assumed.
Repair or Replace? The Numbers Owners Actually Ask For
Strengthening is rarely chosen on engineering merit alone. Five comparisons that decide the argument, from downtime and embodied carbon to residual life.